Lewis
* Ace Member *
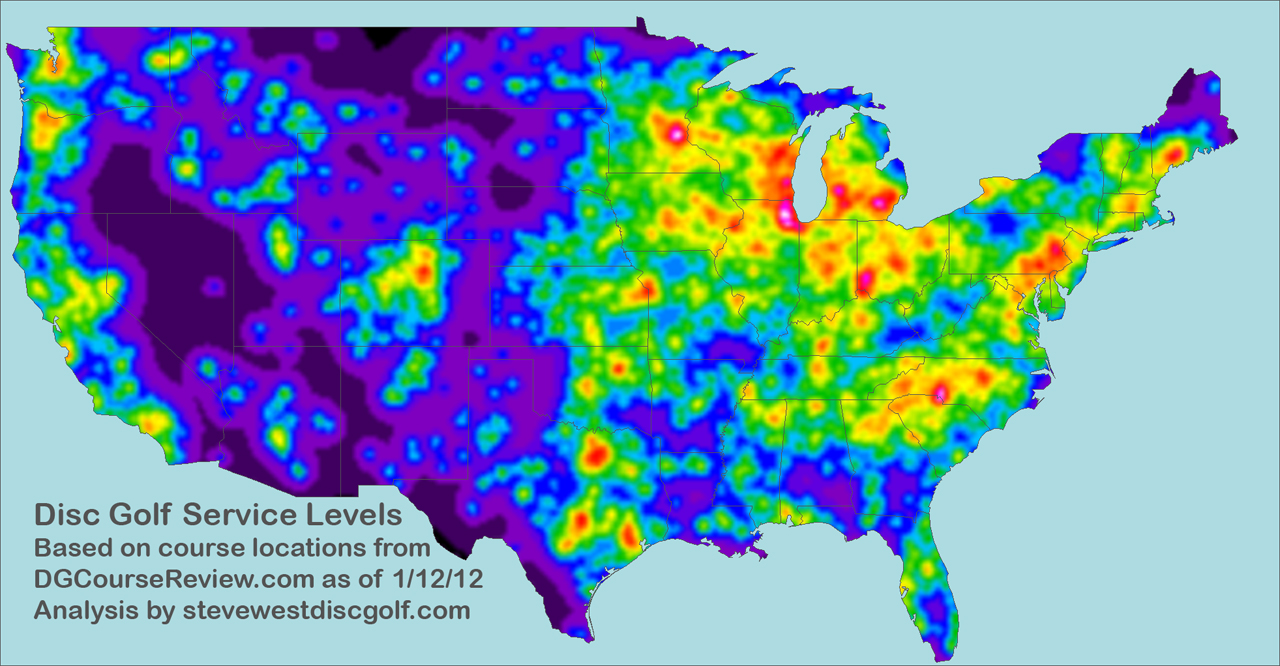
I've been wanting to figure out a way to show survey data by state, like you see in all those infographics on the internet about who says "soda" and who says "pop". After some research on how to do it in Excel, I finally figured out a way. While doing this, I created a map to show the density of disc golf courses per state, which I've attached as an image. I was kinda surprised to see how well, for example, Delaware, which has only 12 courses, compares against Texas, which has over 300, when you adjust for land area. Check it out and see if you notice anything interesting.


